XRP Unable to Match BTC’s Recovery in the Last 24 Hours

Crypto enthusiast Bill Morgan, revealed in a tweet today that the price of Ripple (XRP) was able to bounce back slightly over the past 24 hours. During this time, Bitcoin (BTC) and the rest of the altcoin market experienced the same trend. However, he noted that altcoins recorded a bounce that was weaker and quicker than that of the market leader.
XRP price bounce back v. Bitcoin price bounce back over the last day. There is some correlation but the XRP bounce is weaker & more quickly & deeply reversed. This broad pattern is seen in other altcoins. None of this is specific to XRP even if XRP’s performance looks esp. tepid. pic.twitter.com/PxWPzN0ehh
— bill morgan (@Belisarius2020) September 12, 2023
At press time, CoinMarketCap indicated that BTC’s price was up 0.08%. Subsequently, the cryptocurrency was changing hands at $25,803.23 at press time. XRP, on the other hand, was down 1.77%.

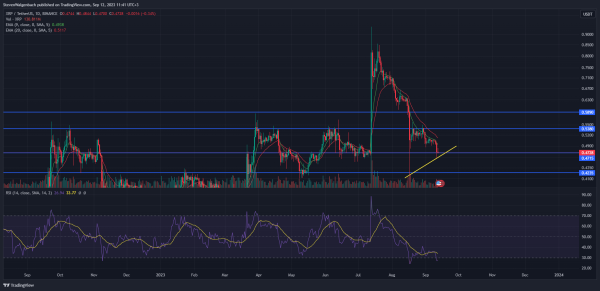
Daily chart for XRP/USDT (Source: TradingView)
From a technical standpoint, XRP’s price had been following a positive trend line on its daily chart for the last two weeks. Consequently, if this trend line is breached, it could signal the end of the short-lived bullish trend for XRP, and there is a possibility that XRP’s price might test the immediate support level at $0.4715 in the next few days.
Should this potential selling pressure persist, XRP’s price may also face the risk of dropping to a critical support level at $0.4235 in the upcoming week. However, if XRP’s price manages to close a daily candle above the 9-day EMA line, which is situated around $0.4940, within the next 48 hours, it could negate the bearish outlook.
In such a scenario, XRP’s price might attempt to turn the resistance level at $0.5380 into support. Furthermore, continued buying support could potentially drive the remittance token’s price as high as $0.5890 in the following week.
Investors and traders should be aware that short-term momentum was in favor of bears when considering a long position for XRP. Firstly, the 9-day EMA line was positioned bearishly below the 20-day EMA line.
Additionally, there was a notable bearish technical signal on XRP’s daily chart as the daily RSI line crossed below the RSI SMA line over the last 48 hours of trading. These technical signals indicate the possibility of a drop in XRP’s price in the next 24-48 hours.
Disclaimer: The views and opinions, as well as all the information shared in this price analysis, are published in good faith. Readers must do their own research and due diligence. Any action taken by the reader is strictly at their own risk. Coin Edition and its affiliates will not be held liable for any direct or indirect damage or loss.