XRP at a Critical Decisive Point Amid Reduced Volatility and Mixed Signals at $0.51

XRP is currently trading at a decisive point as it witnesses a drastic reduction in volatility, which could trigger a massive momentum to the up or downside.
The crypto market is facing a period of extensive consolidation, as most assets trade within close ranges. Amid this consolidation, XRP observes reduced volatility, which could subsequently trigger upward or downward momentum.
Since dropping from the $0.55 territory on August 20, XRP has failed to make any substantial price swings due to the declining volatility. The asset has continued to consolidate between $0.5030 and $0.5398.
XRP Faces Reduced Volatility
For over one week, XRP has neither breached the $0.54 territory nor broken below the $0.50 point. This pattern suggests a prevalence of uncertainty among investors and market participants.
The reduced volatility is not unique to XRP alone, as the entire crypto market faces the same trend. Despite a generally green market, assets such as Bitcoin (BTC) and Ethereum (ETH) have failed to break above or below crucial territories.
While XRP remains below the 50-day EMA ($0.5828), the asset is battling to reclaim and stay above the 200-day EMA ($0.5171). However, XRP has been consolidating at the 200-day EMA for the past eight days with no clear direction.

XRP 24H Chart | TradingView
Interestingly, this period of decreasing volatility is a critical point for XRP. Its next move from here would determine the general direction for the next few days. The trend is usually a precursor for a massive run to the upside or downside as market participants begin to make decisive trades.
If participants troop into the market with purchases, it could lead to a price pump. However, if their re-entry is marked with a dominance of selloffs, this could trigger further selling pressure, leading to a downturn.
Mixed Signals
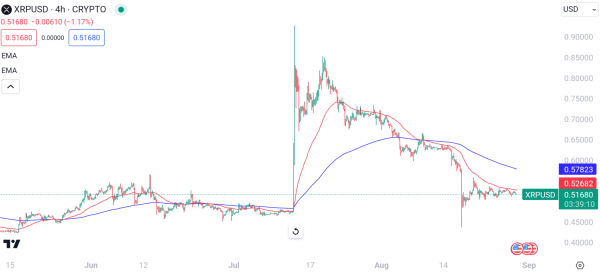
XRP faces mixed signals on varying timeframes to add to the market uncertainty. The asset witnessed a bullish golden cross on the 4-hour chart last month. This pattern occurred when the 50-day EMA crossed above the 200-day EMA on July 13.
A golden cross is a bullish pattern that signals imminent bullish momentum. The 50-day EMA remained above the 200-day EMA until August 9, facing a drop on that day.

XRP 4H Chart | TradingView
Currently, the 50-day EMA is below the 200-day EMA on the 4-hour chart. This pattern is a bearish signal, indicating that XRP’s price is correcting downwards, and the market could witness an extensive downtrend.
However, on the daily timeframe, the 50-day EMA remains above the 200-day EMA after crossing above it in March. These contrasting patterns in the 4-hour and 24-hour charts show mixed signals, compounding the market uncertainty.
Meanwhile, XRP is changing hands at $0.5168 as of press time, down 1.17% over the last 24 hours. Notably, the 50-day EMA has continued to drop, suggesting downward momentum for XRP.