Weekly Analysis: BTC, NEAR, OP, STX, SEI

Bitcoin Price Analysis
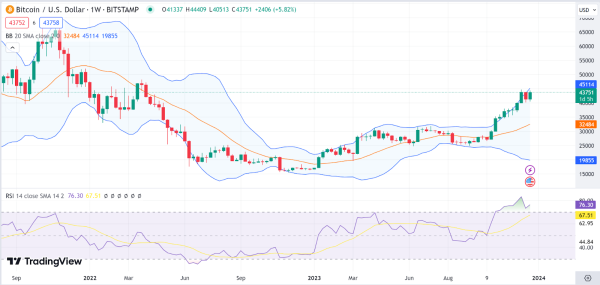
This week has seen the majority of altcoins gain as markets rode on ETF approval anticipations. The Bitcoin price has jumped by 3.3% in the last 7 days to trade at $43.7K as of press time. The Relative Strength Index indicator is moving north while in the overbought region, showing bull dominance on the crypto king over the week.
The MACD indicator is also in the green zone, backing bullish prospects. The Bollinger bands are diverging away from each other, showing high volatility levels on Bitcoin over the period.

BTC 7-day chart | Source: TradingView
NEAR Protocol Price Analysis
NEAR Protocol (NEAR) has been among this week’s top gainers, having posted impressive gains. The NEAR price has jumped by 50% in the last 7 days to trade at $3.55 as of press time. The Relative Strength Index indicator is in the overbought region as it maintains its upward trajectory, displaying the immense bullish activity over the week on NEAR.
The MACD indicator is also in the green zone, an indication of a continuous pump in the short term. The Bollinger bands are diverging away from each other, showing high volatility levels on NEAR Protocol price over the week.

NEAR 7-day chart | Source: TradingView
Optimism Price Analysis
Optimism (OP) has been another gainer this week. The Optimism price pumped by 48% within the seven days as it traded at $3.32 as of press time. The Relative Strength Index indicator is also in the overbought region in attribution to the bullishness over the period.
The MACD indicator is also in the green zone, backing bullish prospects as the Bollinger bands diverge away from each other, showing high volatility levels on Optimism over the week.

OP 7-day chart | Source: TradingView
Stacks Price Analysis
Stacks (STX) was also not left behind, as it posted notable gains in the week. The Stacks price pumped by 49.8% over the period to trade at $1.5 as of press time. The Relative Strength Index indicator is also moving north while in the overbought region, showing bull dominance over the week.
The MACD indicator is also in the green zone, showing bullishness on stacks over the period. The Bollinger bands are diverging away from each other, showing high volatility levels on the Stacks price over the period.

STX 7-day chart | Source: TradingView
Sei Price Analysis
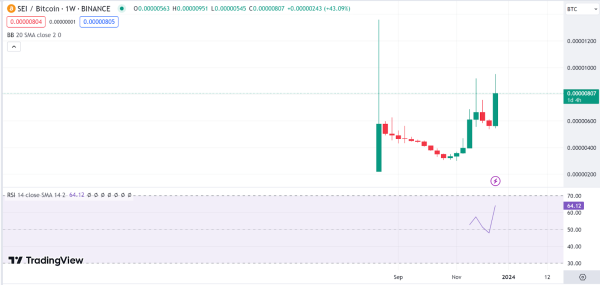
The Sei price has also jumped by 45% in the last 7 days to trade at $0.35 as of press time. The Relative Strength Index indicator is moving north, showing bull dominance over the week on the token.
The Sei price is, however, at risk of facing corrections should holders look to sell for profits, an action that could spark selling pressure, causing a price plunge.

SEI 7-day chart | Source: TradingView
Source