Solana Technical Analysis: High Volatility Expected, Can SOL Return to Its Former Days?

Solana (SOL), despite its impressive recovery, has been showing a downward trend in its overall price movement. The recent price movement from $17.3 to $20.54 meant that bulls gained an 18% profit. However, surpassing the $20 level could be challenging.
Solana Analysis
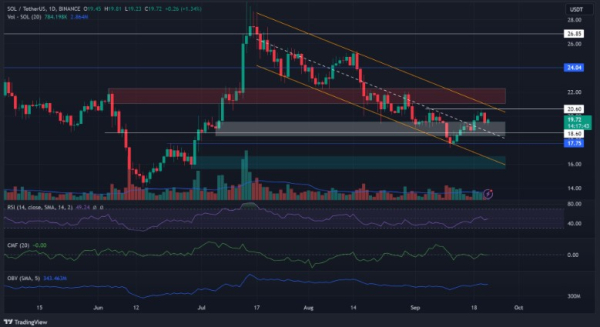
On the daily chart, the price movement has formed a descending channel since July. The recent recovery movement on September 11 bounced off the lowest level of the channel ($17) and slightly eased in the mid-range, pausing near the high range.
At the time of writing, the pullback could lose its strength in the 12-hour bullish order block (OB) between $18.3 and $19.5 (white). There could be a confluence with the mid-range of the OB, which could facilitate a price reversal if Bitcoin (BTC) does not suffer further losses in the medium term. Therefore, $16, $17.75, and the mid-range ($18) can be considered as key interest levels for buyers.

However, the $20 level consists of resistance levels coming together. At the time of writing, SOL had not surpassed $20.60, and the daily timeframe turned the market structure bearish. There is a bearish OB above the December high, which could make it difficult to exceed $20 unless BTC recovers.
As indicated by OBV, spot market demand also seemed to have affected the recent recovery. However, CMF and RSI appeared to have stalled near key threshold levels. This indicates a decrease in buying pressure and inflow of funds.
The Future of Solana
As indicated by CVD (Cumulative Volume Delta), sellers seemed to have gained more control over the market due to the prolonged decline. Additionally, the Open Interest rate decreased, which could mean a slight decrease in demand.
Furthermore, the negative Accumulation Swing Index (ASI) emphasizes that SOL’s price movement is in a long-term downtrend. ASI tracks the strength of price fluctuations, and a negative reading indicates that sellers are gaining more strength, especially on higher timeframe charts.

Disclaimer: The information provided in this article does not constitute investment advice. Investors should be aware that cryptocurrencies carry high volatility and should conduct their own research when making transactions.
Source