SOL Price Prediction: Bulls Poised For New Rally, Solana Strengthens Technical Outlook

Solana has set out into the new week with a vivid bullish outlook—1.6% in 24-hour gains to highs almost at $20. This competitive smart contracts token, like many of its peers, continues to deal with a rather dilapidated market structure, as losses accumulate to 14% in 30 days. SOL price closed the month of August noticeably lower than the monthly opening price of roughly $25.
SOL Price On The Move To $30
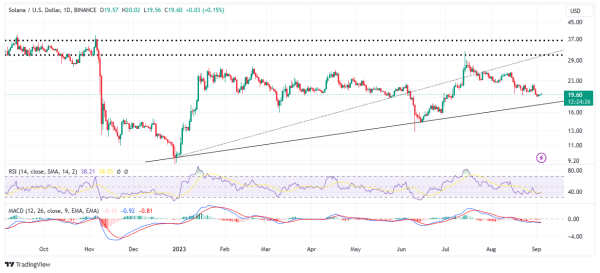
Key indicators, especially short-term reveal that the path with the least resistance has finally flipped to the upside. Solana has since the beginning of September sustained a bullish outlook, bolstered by support at $18.
However, the validity of the uptrend will depend on whether bulls can bring down the resistance at $20. Such a move would imply a stronger bullish grip reinforced by a buy signal from the Moving Average Convergence Divergence (MACD) indicator.
In that case, traders should be on the lookout for a bullish cross, with the blue MACD line flipping above the red signal line.
The Relative Strength Index (RSI), although not oversold in August is in the process of validating the ongoing rebound above $20.

SOL/USD daily chart | Tradinview
A break above $20 might not be enough to propel the Solana live price to $30, hence bulls must not rest until Solana holds above the next crucial hurdle at $23. If they manage to bring down this hurdle, traders can start booking profits at $25, $30, and later at $37.
SOL Price Flaunts Falling Wedge Pattern
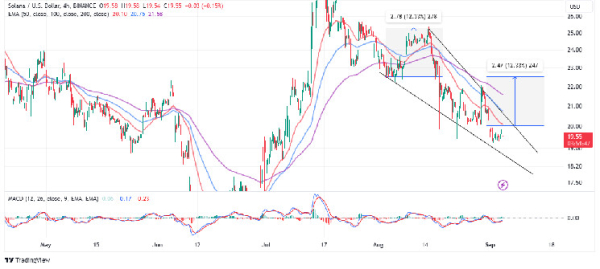
A falling wedge pattern on the four-hour chart hints at a 12% breakout to $22.5, This pattern serves as hope that the downtrend is coming to an end and bulls are ready to take over. Two downward-slopping trendlines form this pattern, one connecting the series of lower highs and the other the lower lows.
As the trendlines converge, the trading volume drops. SOL price will mark the beginning of the uptrend by breaking above the resistance trendline before the lines converge. Buy orders are usually above the breakout point with the target representing the distance between the widest points of the pattern.

SOL/USD four-hour chart | Tradingview
The MACD in the short-term chart already flipped bullish, calling on traders to fire up their buy orders. Notice the blue MACD line above the red signal line and the momentum indicator generally moving toward the mean line and the positive region.
If resistance at $20 holds in place, SOL price may remain vulnerable to seller influence. Support at $18 is expected to come in handy but there is the possibility of Solana sliding to $15 and testing post-FTX implosion support at $8.
Related Articles
- BTC Price Launches New Week Under $26k, Major Rally On The Horizon?
- BTC Price Launches New Week Under $26k, Major Rally On The Horizon?
- Ethereum Soars In Unique Addresses After SEC Hints At Ether ETF Approval