Shiba Inu Price at 16-Month Resistance Faces 20% Downside Risk, But There’s a Catch

In December, the second-largest memecoin Shiba Inu, showed resilience against the broader market’s uncertainty by embarking on a steady recovery. The month began with the coin valued at $0.0000085, and it experienced a notable surge of 44.85%, reaching a recent peak of $0.0000115. However, this uptrend encountered a significant obstacle at the resistance trendline of a long-established falling wedge pattern. This development brought in substantial supply pressure, potentially steering Shiba Inu towards a new correction phase.
Also Read: Major SHIB Developments Scheduled As per Shytoshi Kusama , Shiba Inu Price To Rally?
Will the SHIB Price Fall Back to $0.00001?
- The SHIB price may prolong the downtrend until the wedge pattern is intact
- The 20-day EMA continues to bolster a mid-term recovery
- The intraday trading volume of Shiba Inu is at $831 Million with a 300% gain.

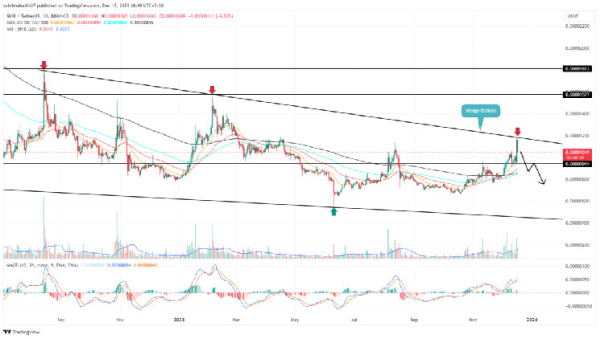
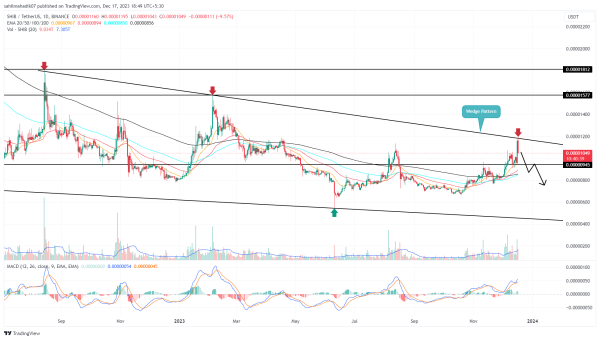
Shiba Inu Price| TradingView Chart
The past two months have been bullish for Shiba Inu, with the coin embarking on a strong recovery journey. Starting at $0.00000661, it soared nearly 80%, achieving an eight-month high of $0.00001195.
A broader perspective reveals that this rally is part of a falling wedge pattern, suggesting a sustained downtrend over the past year. Currently trading at $0.0000107 after an intraday decline of 7.5%, the coin’s trajectory has been influenced by increasing selling pressure following retests of the upper trendline.
Historically, these retests have led to notable downturns. A potential reversal in the near term could see Shiba Inu price encountering demand at $0.00000945 and the 200-day EMA at $0.00000852, indicating a potential drop of about 20%.
A fall below these levels could mark a significant downturn for SHIB.
Wedge Pattern Hints Early Sign of Trend Reversal
Despite the short-term bearish outlook, the falling wedge pattern often precedes a trend reversal. With the broader market sentiment remaining optimistic, a support establishment at $0.0000945 could herald a bullish breakout for SHIB. Such a breakout would amplify buying pressure, potentially propelling the coin towards targets of $0.000015 and then $0.000018.
- Moving Average Convergence Divergence: A positive crossover state between the MACD(blue) and signal(orange) slope highlights the recovery trend is intact.
- Exponential Moving Average: A potential bullish crossover between the 100 and 200-day EMAs could strengthen the recovery trend.