Ripple (XRP) Price Could Suffer Another Setback If This Happens

Ripple (XRP) price has dropped toward the $0.50 support level as the bears knocked back another rebound attempt. On-chain indicators provide insights into some of the inhibiting factors behind the pullback.
Despite the 37% XRP price correction from the 2023 peak, the XRP Ledger (XRPL) has maintained a healthy network activity. Two critical factors could cause another pullback in the coming weeks.
Despite Bearish Sentiment, XRP Network Activity Has Not Deteriorated
XRP has continued to grabble with bearish tailwinds since the altcoin market crash on August 17. But despite the price downtrend, on-chain data shows that the economic activity on the XRP Ledger blockchain network has not deteriorated.
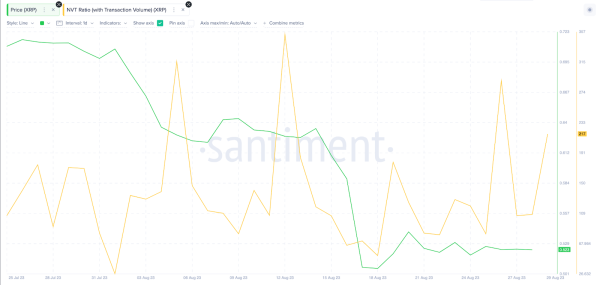
As shown below, the XRP Network Value to Transaction Volume (NVT) ratio has continued to trend upward since the start of August. As of August 29, it currently sits at 217, up 400% from the 51.85 recorded at the local bottom on August 18.

Factors Slowing Down Ripple (XRP) Price Rally | NVT Ratio, Aug 2023 | Source: Santiment
Concisely put, when the NVT ratio rises, as observed above, it indicates a steady growth in underlying economic activity relative to the price action. Typically, when transaction volumes rise, price and network demand increase.
Hence, XRP’s current undervalued status suggests other factors outside of network demand could be responsible for driving the price downward.
Empower your investments with XRP price predictions.
XRP Long-Term Holders Have Been Selling Their Coins
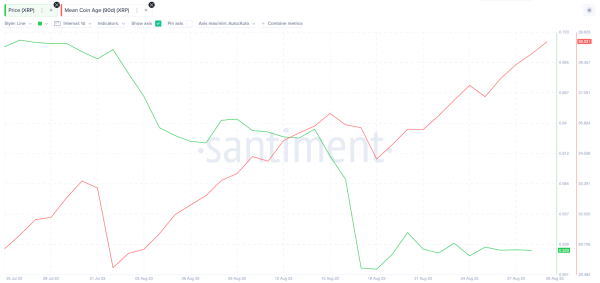
While XRP network demand has remained healthy, on-chain data reveals a worrying trend of bearish trading activity among long-term holders. Indication of this, XRP has witnessed several noticeable blips in the Mean Coin Age throughout August.
Although to varying degrees, the chart below illustrates that the most noticeable XRP price corrections on August 1, August 16, and August 25 have each been preceded by a significant drop in the Mean Coin Age.

Factors Slowing Down Ripple (XRP) Price Rally | Mean Coin Age, Aug 2023 | Source: Santiment
The Mean Coin Age data measures the overall trading sentiment among long-term investors. It is derived by estimating the average number of days that coins in circulation have been unmoved from their current wallet addresses.
Typically, a downtrend in the Mean Coin Age indicates that many long-term investors sold their coins during that period. The chart above establishes a significant correlation between the Mean Coin Age blips and recent XRP price corrections.
Hence, this suggests that if the long-term holders keep closing their positions, they could cause more pullbacks in the coming weeks.
Check Out the Best Upcoming Airdrops in 2023
XRP Price Prediction: Possible Reversal Below $0.50
While the current prices are unfavorable to recent investors, those who bought XRP months ago during the SEC lawsuit turbulence may be more willing to sell.
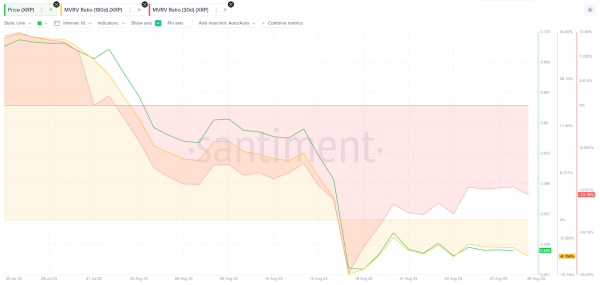
The Market Value to Reallized Value (MVRV) ratio, which gauges the net financial position of current holders, also validates this prediction.
With prices currently sitting at $0.51, investors who bought XRP within the past month will make 13.2% losses if they sell today. Meanwhile, those who bought 180 days ago will only book losses nearly half of that, at 6.7%.
Recent trading patterns show that the 180-day holders had stopped selling around the 10% loss range during the August 17 crash. If they repeat the same trend, they could continue selling until the XRP price hits $0.49. And if that support level cannot hold, XRP could drop as far as $0.45.

Ripple (XRP) Price Prediction – MVRV Ratio. Aug 2023. Source: Santiment
Conversely, the long-term XRP investors could hold out for around 5% gains. But if they close their positions when they break even, XRP could face significant resistance at the $0.54 territory.
But if market momentum flips bullish, XRP price could ride the wave of the growing network activity and promptly reclaim $0.60.