PEPE Reaches 5-Month High – Has Accumulation Ended?

PEPE, one of the most popular memecoin, has been experiencing an upward trend for a week. The little brother of Dogecoin (DOGE) and Shiba Inu (SHIB) broke out above long-term resistance levels today and is seeing 5-month highs.
If PEPE’s bullish price action continues, it is possible that the long-term accumulation could end and move toward the next resistance level at $0.00000190. On the other hand, if today’s price action turns out to be just a deviation, memecoin could return to the previous support area at $0.00000102.
PEPE Reaches 5-Month High
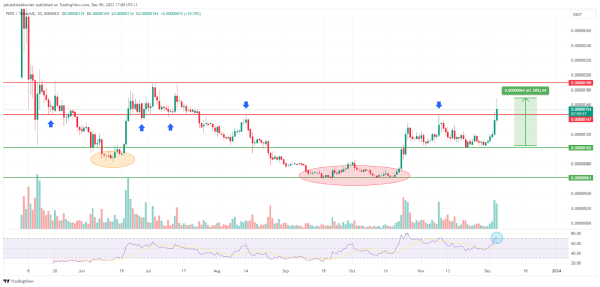
One of the most popular memecoin has been in long-term accumulation since June 2023. At that time, it dropped to a low of $0.00000082 (orange ellipse). The initial surge validated the $0.00000190 level as resistance and led to the continuation of the downtrend.
Then, between mid-September and mid-October, PEPE generated a double-bottom pattern in the $0.00000061 area (red ellipse). The subsequent upward movement validated resistance at the key $0.00000147 level. This area has repeatedly acted as support and resistance (blue arrows), so it is crucial for determining the direction of the trend.

PEPE/USDT chart by Tradingview
PEPE has broken out above this level and is trying to close the daily candle above. If this happens, it could signal the end of the long-term accumulation period and the resumption of the uptrend.
The breakout above this key resistance was made possible by a series of 6 bullish candles initiated on November 30. Counting from the bottom to the top of today’s upper wick, this is an increase of 61.50% in less than a week.
The daily Relative Strength Index (RSI) confirms the validity of the breakout and is just entering bullish territory (blue circle).
Market traders use the RSI as a momentum indicator to identify overbought or oversold conditions. In addition, they decide whether to accumulate or sell assets based on it. Readings above 50 and an uptrend indicate that the bulls still have the advantage, while readings below 50 suggest the opposite.
What Are Analysts Saying?
Traders and members of the memecoin community at X are bullish on PEPE’s future price action. For example, @Crypto_McKenna published his own price prediction today with a long position with a target of $0.00000220. If this prediction came true, PEPE would rise another 42% from its current price.

PEPE/USDT chart / Source: X
On the other hand, trader @DrCryptoPlague warns that despite the increases, this is not the time for FOMO. He wrote:
“Now is not the time to FOMO into $PEPE, the upside for this descending trendline breakout came perfectly. We should wait for the retest and see if it holds.”
PEPE Price Prediction: Next Target at $0.00000190
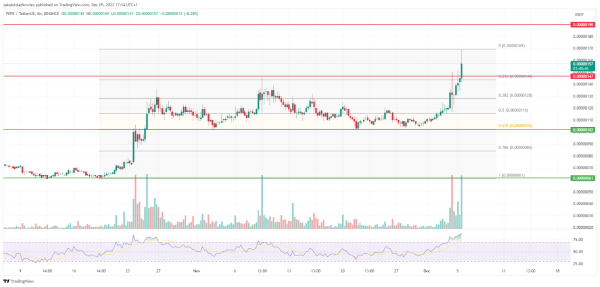
On the lower 6-hour time frame, we see that the breakout above the key resistance at $0.00000147 is supported by increasing trading volume. Moreover, the RSI is deep in overbought territory (above 88) but has not yet generated a bearish divergence.
If the uptrend continues, the nearest target is the $0.00000190 level. This area served as resistance in July 2023. Its recovery would be a strong confirmation of the return of the uptrend.

PEPE/USDT chart by Tradingview
However, if PEPE does not close above resistance, the entire breakout must be considered a deviation. Then, a decline back to support at $0.00000102 is possible. Moreover, this level confluences with the 0.618 Fib of the upward movement.
However, a retest of the 0.382 Fib retracement at $0.00000128 is expected in case of a shallow correction. If this one holds, the upward trend will continue.
For BeInCrypto’s latest crypto market analysis, click here.