Manta Network Price Prediction: Will $MANTA Lose $2 Amid Current Market Sell-off?

Manta Network Price Prediction: MANTA, the native token of the Manta Network, has garnered significant attention in the crypto market following its recent launch on several major cryptocurrency exchanges and an accompanying airdrop. Initially, the listing of MANTA on these exchanges sparked a price surge, peaking at $2.78.
However, this uptrend experienced a rapid reversal due to a combination of factors: a distributed denial-of-service (DDoS) attack impacting operations, and a broader market sell-off. As market sentiment currently indicates a prolonged correction, there’s growing speculation about whether this new altcoin can maintain its value above the $2 threshold.
Manta Network Price Prediction: Will $MANTA Sustain Above $2?
- A bearish breakdown from the channel pattern should strengthen the seller’s grip over this asset.
- The falling price may witness strong demand at the $2 mark
- The intraday trading volume in MANTA is $296 Million, indicating a 36% gain.

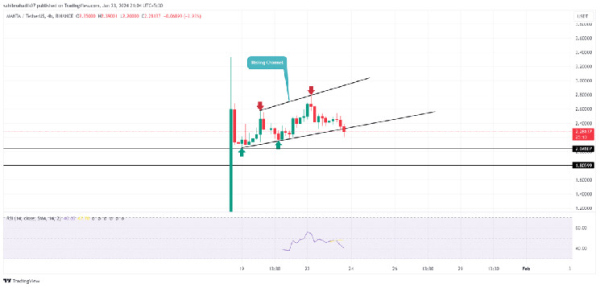
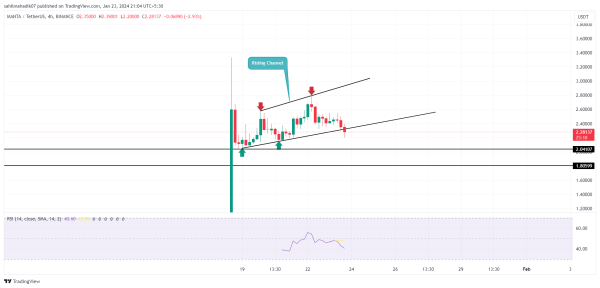
Manta Network Price Prediction| TradingView Chart
Manta Network, an innovative web3 ecosystem, offers a modular environment tailored for developing and deploying Solidity-based decentralized applications. This platform stands out by combining high transaction speeds with lower gas costs, characteristics often associated with Layer 2 (L2) solutions.
On January 18, Manta Network introduced its native token, MANTA, across multiple cryptocurrency exchanges boosting its market capitalization to $550 million. This successful launch was quickly overshadowed by challenges, as the network soon encountered a distributed denial of service (DDoS) attack, which affected the network’s functionality, resulting in prolonged withdrawal times and overall reduced network performance.
⚠️ Because of yesterday’s DDoS attack, the network has accumulated a large queue of recent transactions. This is leading to longer transaction times and impacts on gas fees. We are aware of this issue and working to resolve it.
— Manta Network (🔱,🔱) #MantaNewParadigm (@MantaNetwork) January 19, 2024
Although the issue was promptly addressed and resolved, the MANTA price has experienced considerable volatility over the past four days. Analyzing the 4-hour timeframe reveals that the coin’s price initially adhered to a channel pattern formation, using two trendlines to stabilize its high value. Despite this, a recent intraday loss of 6% led to a breach of the pattern’s lower trendline, paving the way for potential corrections.
Should MANTA Price maintain its position below this breached trendline, it could indicate an increase in selling pressure, potentially driving the price down to $2, and possibly further to $1.8.
- Exponential Moving Average (EMA): The MANTA price below the 20-day EMA slope indicates the short-term market sentiment is sideways to bearish,
- Relative Strength Index (RSI): The daily RSI at 40% accentuates the bearish momentum is aggressive in the current state.