MANA, MATIC, GMT May Rise Soon as Chart Patterns Look Promising

The global cryptocurrency market cap dwindled throughout the past day of trading, according to CoinMarketCap. At press time, the market’s valuation was down 0.17% and stood at around $1.04 trillion.
As a result, traders may step in to purchase cryptocurrencies at a discount. Most notably, chart patterns present on the charts of MATIC, GMT, and MANA suggested that these 3 altcoins may enter into a brief bullish move soon – potentially opening up fair trade opportunities for investors and traders.
Polygon (MATIC)
MATIC found itself stuck in a medium-term negative price channel, which suggested that the altcoin may have a fair amount of work to do before it can overcome the strong bearish trend. Nevertheless, traders were attempting to boost the cryptocurrency out of this descending price channel.

Daily chart for MATIC/USDT (Source: TradingView)
At press time, MATIC was trading at the upper level of the current price channel. As a result, the altcoin closing today’s trading session above the $0.4970 support level may be an early indication of MATIC finally breaking out of the bearish trend it had been in for the past few weeks.
In this scenario, MATIC may continue to climb to potentially flip the resistance level at $0.5500 into support. Thereafter, continued buy support could elevate the Layer-2 cryptocurrency’s price to the subsequent barrier at $0.6500 in the following few days. This bullish thesis could be invalidated if MATIC breaks below the aforementioned $0.4970 support in the next 48 hours.
In a bearish scenario, MATIC may lose the support of the $0.4970 mark before embarking on a journey toward the crucial $0.4475 support level. Traders and investors will want to note that technical indicators on MATIC’s daily chart supported a more bearish short-term outlook.
Over the past 48 hours, the daily RSI line crossed below the daily RSI SMA line. This noteworthy technical event suggested that sellers have gained the upper hand on MATIC’s daily chart. In addition to this, the daily MACD line was attempting to cross below the daily MACD Signal line.
Should the MACD line cross below the MACD Signal line in the upcoming few days, it will suggest a continuation of MATIC’s bearish trend. Furthermore, if these technical flags are validated, MATIC’s price may drop to the previously mentioned $0.4475 support.
STEPN (GMT)
A breakout pattern had formed on the daily chart for GMT/USDT over the past 2 weeks. This noteworthy chart pattern suggested that the altcoin’s price may enter into a strong move in the short term. Meanwhile, technical indicators on GMT’s chart were giving mixed signals, which may indicate the cryptocurrency’s price could break out either way soon.

Daily chart for GMT/USDT (Source: TradingView)
At press time, the 9-day EMA line was attempting to cross above the 20-day EMA line. This was after GMT’s trading volume over the past 9 days was more bullish than the trading volume recorded over the previous 20 days. If these 2 lines cross in a couple of days, it may indicate that short-term momentum has shifted in favor of bulls.
If this potential technical flag is validated, GMT’s price may break above the $0.1650 resistance level before possibly attempting a challenge at the subsequent barrier at $0.1990. Contradicting this bullish thesis was the daily RSI line, which was looking to cross bearishly below the RSI SMA line on GMT’s daily chart.
Should these 2 technical indicators cross, it may suggest that sellers have gained the upper hand. As a result, the altcoin’s price may break out towards the downside. In this scenario, GMT may fall below the immediate support level at $0.1415 to set a new all-time low in the proceeding few days.
Decentraland (MANA)
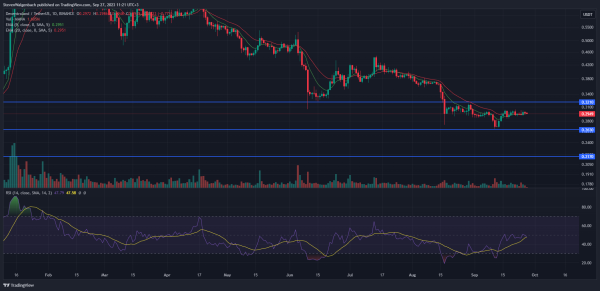
Similar to GMT, the daily RSI line on MANA’s chart was looking to cross below the daily RSI SMA line. Meanwhile, the 9-day EMA line was at the same position as the 20-day EMA line at press time. The equal positioning of these 2 EMA lines suggests that investors and traders are waiting for a confirmation of which direction MANA’s price will move in.

Daily chart for MANA/USDT (Source: TradingView)
Traders may identify the daily RSI line crossing below the daily RSI SMA line as a confirmation of a bearish short-term trend. Consequently, MANA’s price may drop to the immediate support level at $0.2630 as traders possibly begin to short the metaverse token. Continued sell pressure may then force MANA’s price below this mark to the next key level at $0.2170.
On the other hand, if bulls are able to prevent the daily RSI line from crossing below the daily RSI SMA line, then the 9-day EMA may break above the 20-day EMA line. This could potentially signify a positive shift in MANA’s short-term trend. Subsequently, the altcoin may attempt to overcome the $0.3210 threshold in the following few days.
Disclaimer: The views and opinions, as well as all the information shared in this price analysis, are published in good faith. Readers must do their own research and due diligence. Any action taken by the reader is strictly at their own risk. Coin Edition and its affiliates will not be held liable for any direct or indirect damage or loss.