Fantom Price Prediction: FTM is Sideways at Lowest, What’s Next?

- 1 Fantom price prediction showcases the sideways momentum of FTM crypto.
- 2 FTM crypto is trying to recover from 20, 50, 100 and 200-days daily moving averages.
- 3 Fantom cryptocurrency dropped by 3.41% year to date.
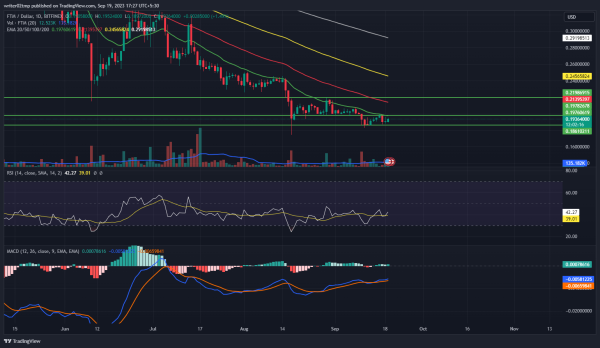
The Fantom price prediction indicates that FTM cryptocurrency is currently facing a challenge near the neckline and the 20-day EMA, which could potentially offer some support. FTM has been making efforts to break through the resistance at $0.19787923 but has yet to reach the upper threshold. However, there are signs that FTM is getting closer to a potential breakout. To sustain this momentum, it’s crucial for buyers to accumulate.
For Fantom cryptocurrency to maintain its recovery, it’s essential to rebound from the 20-day EMA and regain positions above the 50, 100, and 200-day daily moving averages. However, it’s worth noting that the current rate at which buyers are accumulating FTM may not be at the desired level for a sustained recovery over the long term.
Fantom price started at $0.19364000 and saw a 1.49% increase in its market capitalization during the day’s trading session. Nevertheless, there was a notable 12.30% decrease in trading volume intraday. This suggests that sellers are actively accumulating FTM, which could potentially exert downward pressure on its price. The volume-to-market capitalization ratio was recorded at 4.96%.
Will Fantom Price Initiate Its Recovery?

Source: FTM/USD by TradingView
Fantom price prediction suggests the possibility of a recovery starting from a lower point, potentially leading to a significant upturn on the daily time frame chart. However, it’s important to note that there hasn’t been a substantial change in trading volume. Simultaneously, FTM cryptocurrency is working to maintain its position above the 20-day exponential moving average (EMA) as it aims to overcome the hurdles presented by the 50, 100, and 200-day daily moving averages.
Throughout 2023, the price of Fantom displayed fluctuations, indicating the potential for a recovery amidst shifting market dynamics. In the past week, FTM experienced a modest increase of 3.06%, but this contrasts with a noteworthy decrease of 7.10% over the past month. Furthermore, its value witnessed a significant decline of approximately 30.05% in the last three months and a sharp drop of 58.85% in the preceding six months. Fantom cryptocurrency dropped by 3.41% year to date.
Technical indicators for FTM cryptocurrency raise questions about its stability. The relative strength index (RSI) shows an upward trend in FTM’s value, while the moving average convergence divergence (MACD) also suggests a positive momentum.
Presently, the RSI is at 42 and is making efforts to reach a neutral position. Additionally, the MACD line crossed above the signal line, indicating a favorable shift. Investors involved in Fantom cryptocurrency should remain patient and monitor the daily time frame chart for any potential changes in direction.
Summary
The Fantom price prediction indicates that FTM cryptocurrency is currently facing a challenge near the neckline and the 20-day EMA, which could potentially offer some support. However, it’s important to note that there hasn’t been a substantial change in trading volume. Technical indicators for FTM cryptocurrency raise questions about its stability.
Technical Levels
Support Levels: $0.18610211 and $0.17501722
Resistance Levels: $0.19782678 and $0.20584801
Disclaimer
The views and opinions stated by the author, or any people named in this article, are for informational purposes only, and they do not establish financial, investment, or other advice. Investing in or trading crypto or stock comes with a risk of financial loss.