Crypto Price Prediction For January 6: TIA, AKT, SEI

Crypto Price Prediction: On Saturday, the crypto market painted a red picture with the majority of the major witnessing a minor downtick. By press time, the global cryptocurrency market cap has decreased by 2.12% to $1.63 trillion, with a 24-hour trading volume down 18.43% to $65.21 billion.
However, as per the latest development on Spot Bitcoin ETFs, The U.S. Securities and Exchange Commission (SEC) is moving closer to potential approval as indicated by the recent acceptance of filings from major asset management firms. On January 5th, amendments under Rule 19b-4 were filed for spot Bitcoin ETF applications which are considered one of the final stages in the SEC approval process
However, it is important to note that the completion of S-1 documents is still required for the actual listing of these securities.
Moreover, Bloomberg ETF Analyst Eric Balchunas recently shared on the X(formerly Twitter) platform his positive outlook about the SEC potentially greenlighting a Bitcoin ETF in the coming week. However, Balchunas emphasizes the need for official confirmation from the SEC before considering it a done deal.
Yeah, it’s basically done. The latest I’m hearing (from multiple sources) is that final S-1s are due 8 am on Monday as the SEC is trying to line everyone up for the Jan 11th launch. That said, I still want to hear it from the SEC to call it official
Amidst a week of significant volatility in the crypto market, certain tokens like Akash Network (AKT), Celestia (TIA), and Sei (SEI) have consistently exhibited bullish trends. This suggests they possess a stronger potential for recovery once positive market sentiment resumes.
Is Celestial(TIA) Price Heading to $20?

Celestial(TIA) Price| TradingView Chart
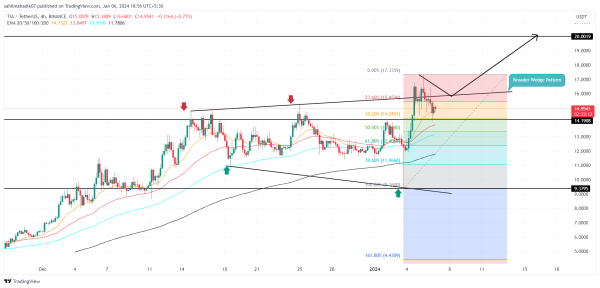
Amid the 3rd January sell-off in the crypto market, the Celestial coin price shows significant resilience and sustainability above the $94 mark. A resulting reversal from this level surged the coin price 84% within two days to reach a high of $17.29.
In the 4-hour time chart, this rally teases a bullish breakout from the 3-week-long broadening wedge pattern, indicating the buyers’ efforts to lead a higher recovery. However, the breakout was short-lived as the increasing uncertainty in the crypto market plunged the TIA price back to $16.15, projecting a fake breakout scenario.
While this bull trap should accelerate the selling pressure, the buyers may find an opportunity to counterattack at the combined support of $14.2 and 38.2% Fibonacci retracement level. A bullish reversal pattern at this support would encourage buyers to rechallenge the last swing high of $17.3 which may prolong a rally to $20.
The 20-day EMA acts as a dynamic support to buyers amid the current pullback
Multiple Support Prepare SEI Price Rally to $1

SEI Price| TradingView Chart
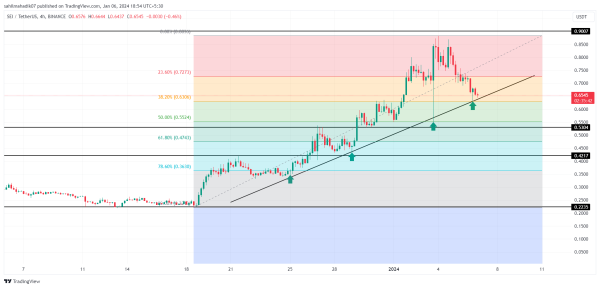
Over the past three weeks, the SEI coin price has shown sustainable growth under the influence of an ascending trendline. Obtaining dynamic support from this trendline, the coin price has soared from $0.22 to a recent high of $0.88, registering a growth of 290%.
However, amid the increasing uncertainty in the crypto market, the SEI coin price has witnessed another correction from the aforementioned high which led it back to the $0.64 mark. The sellers are currently trying to obtain suitable support at the confluence of the ascending trend line 38.2% Fibonacci Retracement Level and the $0.627 mark.
Sustaining above the support would reflect the indication of uptrend continuation, which could surpass the last swing high resistance of $0.88 to hit the $1.00 psychological level.
Repetitive Pattern Sets Akash Network Coin Price For 16.8% Surge

Akash Network Coin Price| TradingView Chart
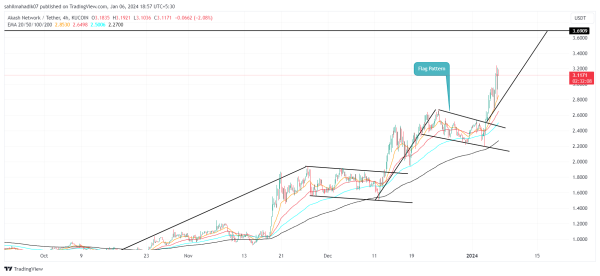
Amid the broader market sentiment, the Akash network coin entered an aggressive recovery trend in mid-October 2023 when the price rebounded from the $0.74 mark. Within the past three months, the coin has surged nearly 322% to reach the current trading price of $3.15 mark.
A look at the Daily time frame Charts shows this rally has formed a repetitive pattern of a bullish flag, which offers buyers an opportunity to recuperate exhaustive bullish momentum for the next push.
On January 3rd, an AKT price provided a similar breakout from the flag pattern, indicating the continuation of the recovery trend. Under a favorable scenario, this recovery should prolong another 16.86% to reach a potential target of $3.6.
An uptick in the upper boundary of the Bollinger Bands indicator reflects the bullish momentum is aggressive.
Related Articles:
- Bitcoin Will See Impact of US Job Market Data; Here’s How
- Bitcoin Halving Nears 100 Day Countdown; BTC Price Rally To Begin?
- Breaking: Satoshi Nakamoto Is Back? Bitcoin Worth Over $1 Mln Moved To Satoshi’s Wallet