Bonk Price Prediction As Renewed Buying Interest Develops into Bullish Pattern

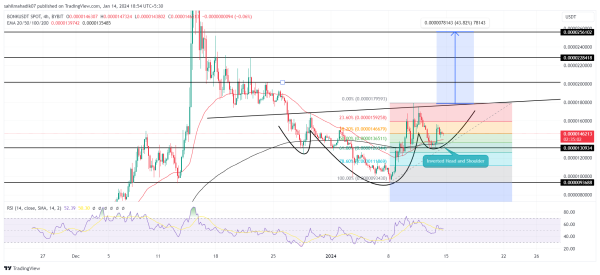
Bonk Price Prediction: Amidst the market excitement over the anticipated approval of Spot Bitcoin ETFs, the Solana-based memecoin Bonk has demonstrated a remarkable recovery from its support level of $0.00000936 earlier this week. This bullish reversal scored 92% growth as the price hit a high of $0.00001795. Amid this upswing, the 4-hour time frame chart showcased the development of a bullish reversal pattern called inverted head and shoulder, indicating the memecoin is poised for further growth.
New Bullish Pattern Sets BONK Rally to $0.00002
- The formation of an inverted H&S pattern indicates an early sign of trend reversal
- A bullish crossover between 50 and 200 EMA should accelerate buyers’ internet in the BONK token
- The intraday trading volume in Bonk is $289.39 Million, indicating an 11% loss.

Bonk Price Prediction| TradingView Chart
Despite the recent approval of Spot Bitcoin ETFs, the Bitcoin price has underperformed, casting a shadow of uncertainty over the cryptocurrency market. This sentiment has prompted a correction across major cryptocurrencies, including BONK, which experienced a significant drop to $0.000013.
Nonetheless, an analysis of the 4-hour chart reveals that this downturn has facilitated the formation of a bullish reversal pattern, known as the inverted head and shoulders. Thus, the BONK price demonstrated resilience above the $0.000013 support and recovered the memecoin 11%, to currently trading $0.0000145.
This chart pattern suggests that buyers could drive the price up by an additional 22%, aiming to reach the neckline resistance at $0.0000177. A successful bullish breakout above this level would provide a stronger indication of a trend reversal, potentially positioning BONK to pursue a further target of $0.0000257.
Why Bonk Is At Risk of a 30% Drop?
The recent correction in BONK’s price found solid ground at a confluence of support—the $0.000013 mark and the 50% Fibonacci retracement level. Such a level of retracement is often viewed as a healthy consolidation in the context of a longer-term uptrend, marking a pivotal zone where buyers need to assert their control to sustain the asset’s bullish momentum.
However, if BONK fails to maintain its current recovery trajectory, a breach below the $0.000013 support level could intensify selling pressure. This potential breakdown might lead to a significant 30% decline in the value of the memecoin, potentially bringing its price down to $0.00001.
- Exponential Moving Average: The BONK price jump above crucial EMAs(20, 50, 100-and-200) indicates the short-term trend is turning bullish.
- Average Directional Index: A falling ADX slope project the buyers try to recover exhausted bullish momentum in occasional pullbacks.
Related Articles
- BONK Introduces PooperScooper to Streamline Asset Management
- Bonk Price Prediction As Chart Pattern Hints End of Correction, Is $0.000025 Within Reach?
- Michael Saylor Delivers Crucial Warning Amid Spot Bitcoin ETF Debut