Bitcoin (BTC), Ethereum (ETH) Register Record Rise In Address Activity

The blockchain intelligence firm Santiment revealed in a tweet this morning that Bitcoin (BTC), Ethereum (ETH), and Tether (USDT) recorded the highest level of address activity. This recent uptick in address activity could be an early indication of substantial price movements in the near future.
📈🧐 The top 10 assets by highest level of address activity:
1 @Bitcoin $BTC
2 @ethereum $ETH (#BinanceChain)
3 @Tether_to $USDT
4 @0xPolygon $MATIC
5 @litecoin $LTC
6 @Tether_to (#Polygon)
7 @worldcoin $WLD
8 #BinanceUSD $BUSD
9 @bitcoincashorg $BCH
10 @Tether_to (#Ethereum) pic.twitter.com/k3NPHLGVVv— Santiment (@santimentfeed) August 25, 2023
The fact that the two market leaders experienced the highest amounts of address activity could indicate that investors and traders are attempting to generate profits from the two cryptocurrencies that have created the most trade opportunities during this bear market. Once investors have completed this quest, they may shift their focus to the altcoin market.
Furthermore, USDT at number 3 on this list could indicate that investors are building up their buying power in order to pump cryptocurrency prices in the coming few months. Once enough buying power has been accumulated, investors and traders will seek opportunities in smaller capped digital assets.
Notably, Polygon (MATIC) and Litecoin (LTC) also posted an increase in wallet activity — occupying the 4th and 5th spot on the top 10 list. Furthermore, Santiment data revealed that BTC, USDT, ETH, MATIC, and LTC have more than double the active addresses of any other cryptocurrency in the market.
At press time, BTC was changing hands at $26,035.81 after its price fell by 1.35% over the past 24 hours. In addition to the negative 24-hour performance, CoinMarketCap indicated that the leading cryptocurrency’s weekly performance was also in the red zone at -1.83%.
Meanwhile, the altcoin leader’s price stood at $1,652.13. This was after ETH suffered a 24-hour loss of 1.26%. Similar to BTC, ETH’s weekly performance was also in the red zone, as the cryptocurrency’s value declined 2.41% throughout the last 7 days.

Daily chart for BTC/USDT (Source: TradingView)
From a technical standpoint, a negative price channel had formed on BTC’s daily chart after the market leader’s price printed lower highs and lower lows over the past few weeks. Furthermore, BTC’s price had been in a consolidation phase between $24,200 and $26,915 for the last week.
If BTC is able to close a daily candle above the $26,916 resistance level, then it may attempt to overcome the next barrier at $30,070. Continued buy support may even boost the cryptocurrency’s price to $32,500 within the next few weeks.
Adding credence to the bullish thesis is the fact that BTC’s price was trading below a medium-term positive trend line that had been established on its daily chart throughout the past few months. Therefore, BTC may look to recover back above this line soon, which will place its price above $30,070.
On the other hand, BTC’s price could continue to consolidate in the upcoming two weeks as traders attempt to recover from the latest market dump. In this scenario, the market leader’s price may be at risk of testing the next key support level at $24,200.

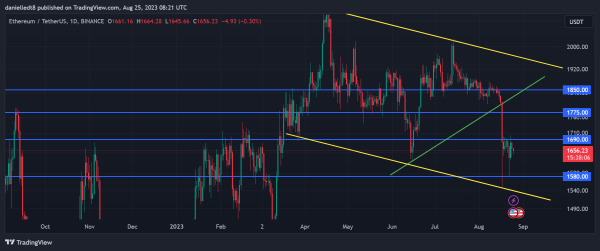
Daily chart for ETH/USDT (Source: TradingView)
Similarly, ETH was also trading below a medium-term trendline that was present on its daily chart, and was also trading within a negative price channel at press time. Most notably, the altcoin’s price was resting close to the lower level of the negative price channel, which may lead to investors identifying ETH’s current price as a buy opportunity — resulting in a price elevation.
This bullish thesis will be validated if ETH closes a daily candle above $1,690. Thereafter, the cryptocurrency will also have a clear path to rise to the next significant price point at $1,775 over the following few days.
Continued buy support could result in ETH’s price reaching a high of $1,850 in the coming weeks. However, ETH failing to close a daily candle above $1,690 within the upcoming 7 days will put it at risk of testing the $1,580 support level soon.
Disclaimer: The views and opinions, as well as all the information shared in this price analysis, are published in good faith. Readers must do their own research and due diligence. Any action taken by the reader is strictly at their own risk. Coin Edition and its affiliates will not be held liable for any direct or indirect damage or loss.